Dr. Reddy’s Q3 & 9M FY23 Financial Results
Hyderabad: Dr. Reddy’s Laboratories Ltd. (BSE: 500124 | NSE: DRREDDY | NYSE: RDY | NSEIFSC: DRREDDY) today announced its consolidated financial results for the quarter and the nine months ended December 31, 2022. The information mentioned in this release is on the basis of consolidated financial statements under International Financial Reporting Standards (IFRS).
Commenting on the results, Co-chairman & MD, G V Prasad said “Our strong financial performance was supported by growth in the US and the Russia markets. We continue to strengthen our development pipeline to reach more patients globally.”
Dr. Reddy’s Laboratories Limited and Subsidiaries
Consolidated Income Statement
All amounts in millions, except EPS All US dollar amounts based on convenience translation rate of I USD = Rs. 82.72
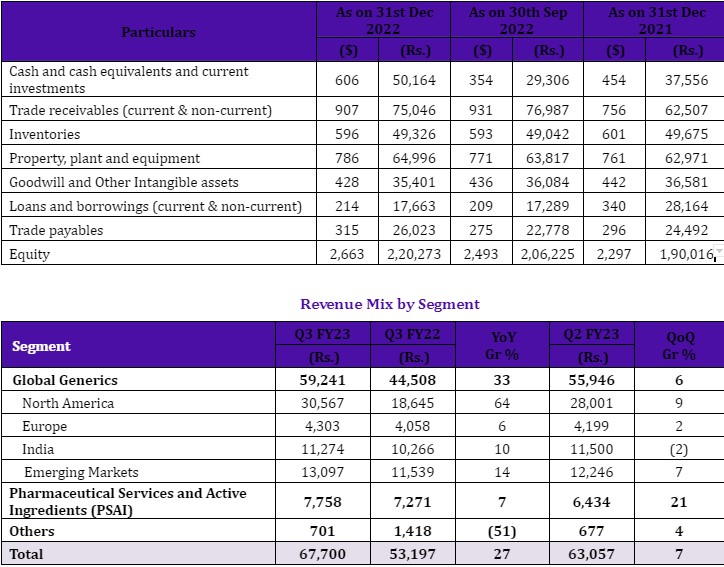
Key Balance Sheet Items
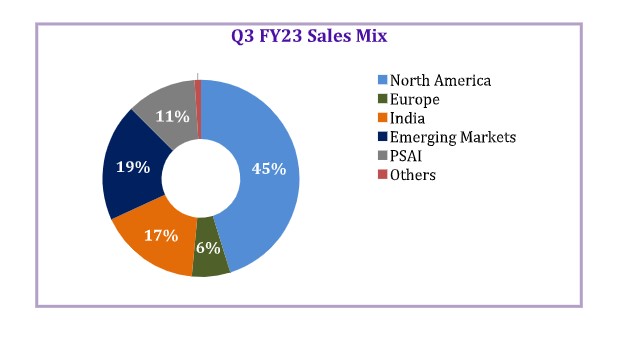
Revenue Analysis
Global Generics (GG)
Revenues from GG segment at Rs. 59.2 billion:
Year-on-year growth of 33% and sequential quarter growth of 6% was primarily driven by new product launches, increase in volumes of our base business and favorable forex movement, offset partially due to price erosion in our generic markets.
North America
Revenues from North America at Rs. 30.6 billion:
Year-on-year growth of 64%, driven by new products launches, increase in volumes and a favorable forex movement, which was partly offset by price erosion.
Sequential growth of 9%, driven by increase in volumes partly offset by price erosion in some products.
We launched five new products in US during the quarter. These were desmopressin MDV, OTC guaifenesin ER, fingolimod capsules, thiotepa injection and biorphen injection.
We filed one new ANDA during the quarter. As of 31st December 2022, cumulatively 78 generic filings are pending for approval with the USFDA (75 ANDAs and 3 NDAs under 505(b)(2) route). Out of these 78 pending filings, 41 are Para IVs and we believe 21 have ‘First to File’ status.
Europe
Revenues from Europe at Rs. 4.3 billion:
Year-on-year growth of 6%, driven by new product launches, increase in volumes which was partly offset by price erosion and adverse forex rates.
Sequential growth of 2%, driven by new product launches and favorable forex movement, and was partly offset by reduction in volumes of certain products.
Revenues from Germany at Rs. 2.2 billion. Year-on-year decline of 1% and sequential decline of 6%.
Revenues from UK/OL at Rs. 1.3 billion. Year-on-year growth of 25% and sequential growth of 16%.
Revenues from other European countries at Rs. 0.8 billion. Year-on-year growth of 3% and sequential growth of 8%.
India
Revenues from India at Rs. 11.3 billion:
Year-on-year growth of 10%, driven by increase in sales prices and new product launches, partly offset by reduction in volumes for certain products.
Sequential decline of 2%, primarily due to reduction in volumes of certain products.
Emerging Markets
Revenues from Emerging Markets at Rs. 13.1 billion. Year-on-year growth of 14% and sequential quarter growth of 7%:
Revenues from Russia at Rs. 6.9 billion. Year-on-year growth of 45% was on account of increase in volumes and prices, new product launches, and favorable forex rates. Sequential quarter growth of 16% was primarily on account of increase in volumes.
Revenues from other CIS countries and Romania at Rs. 2.2 billion. Year-on-year decline of 6% was due to reduction in volumes and adverse forex movement, partly offset by increase in sales price of some products and new product launches. Sequential quarter growth of 4% was driven by new product launches and favorable forex movement.
Revenues from Rest of World (RoW) territories at Rs. 4.0 billion. Year-on-year decline of 10% was on account of higher base in previous year due to the covid product sales and decrease in sales price of some of our key molecules, which was partly offset by new product launches. Sequential decline of 4% was on account of decrease in sales price of some products, which was partly offset by new product launches and favorable forex movement.
Pharmaceutical Services and Active Ingredients (PSAI)
Revenues from PSAI at Rs. 7.8 billion:
Year-on-year growth of 7% was driven by favorable forex movement and increase in volumes partly offset by price erosion.
Sequential growth of 21% was driven by increase in volumes and new product launches.
During the quarter we filed two DMFs in the US.
Income Statement Highlights:
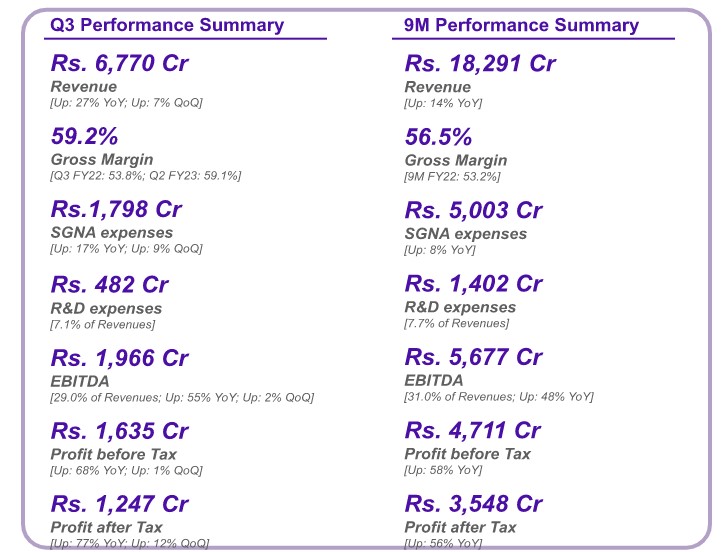
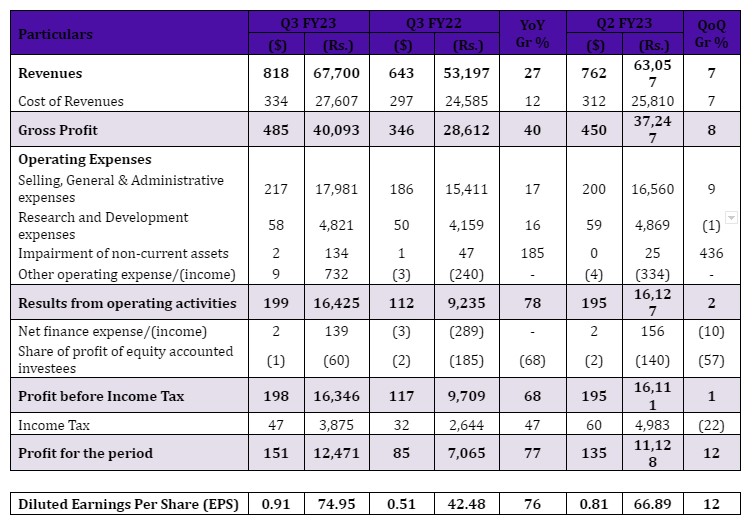
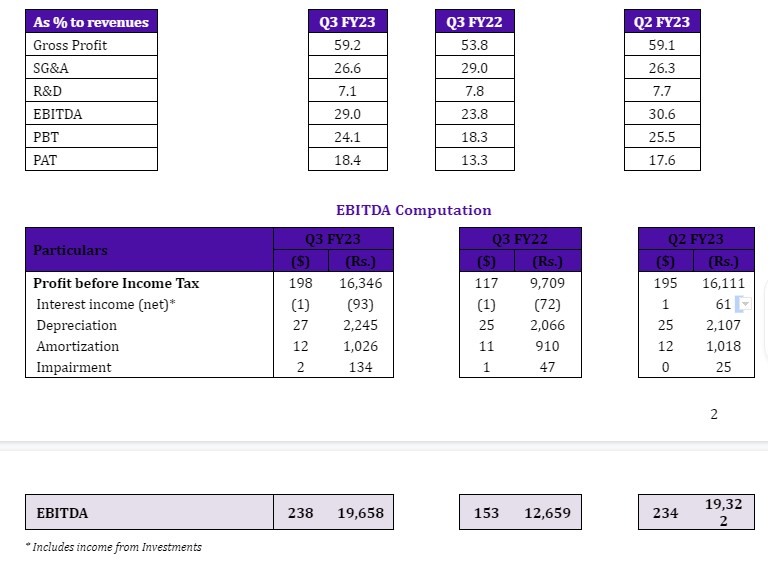
Gross profit margin at 59.2%:
Increased by ~545 bps over previous year driven mainly due to new product launches with higher margins, favorable products mix and favorable forex movement which was partly offset by price erosion. Margins have marginally increased by 15 bps sequentially.
Gross profit margin for GG and PSAI business segments are at 64.6% and 18.2% respectively.
SG&A expenses at Rs. 18.0 billion, increased by 17% year-on-year. This increase was primarily attributable to investments in sales & marketing, annual increments, certain one-off expenses and higher forex rate. Sequentially the SG&A expenses increased by 9% mainly due to increase in sales & marketing spends and other one-off expenses.
R&D expenses at Rs. 4.8 billion. As % to revenues - Q3 FY23: 7.1% | Q2 FY23: 7.7% | Q3 FY22: 7.8%. We continue our focus on investing in R&D to build a healthy pipeline of new products across our markets including development of products in our biosimilars and generics businesses.
Impairment charge of Rs. 134 million as compared to Rs. 47 million charge in Q3 FY22.
Other operating expense at Rs. 732 million compared to income of Rs. 240 million in Q3 FY22. Net other expense during the quarter included the loss on sale of asset at Leiden, Netherlands.
Net Finance expense at Rs. 139 million compared to income of Rs. 289 million in Q3 FY22.
Profit before Tax at Rs. 16.3 billion, which is 24.1% of revenues. The profit before tax increased by 68% year-on-year and by 1% sequentially.
Profit after Tax at Rs. 12.5 billion. The effective tax rate is ~23.7% for the quarter.
Diluted earnings per share is at Rs. 74.95.
Other Highlights:
EBITDA at Rs. 19.7 billion and the EBITDA margin is 29.0%.
Capital expenditure is at Rs. 2.9 billion.
Free cash-flow is at Rs. 19.8 billion.
Net cash surplus for the company is at Rs. 34.0 billion as on December 31, 2022. Consequently, net debt to equity ratio is (0.15).
ROCE for the company is 35.8% (annualized).
Earnings Call Details (07:00 pm IST, 08:30 am EST, Jan 25, 2023)
The management of the Company will host an earnings call to discuss the Company’s financial performance and answer any questions from the participants.